Inflation: Definition, trends, estimates, consequences, and remedies (control): WPI, CPI - components and trends
1.refer ramesh singh for basic terms and understanding
3.What is the GDP deflator and why is it in the news now?
The GDP deflator, also called implicit price deflator, is a measure of inflation. Simply put, it is the ratio of the value of goods and services an economy produces in a particular year at current prices to that at prices prevailing during any other reference (base) year. This ratio basically shows to what extent an increase in GDP or gross value added (GVA) in an economy has happened on account of higher prices, rather than increased output. Since the deflator covers the entire range of goods and services produced in the economy — as against the limited commodity baskets for the wholesale or consumer price indices — it is seen as a more comprehensive measure of inflation.
The deflator is in the news because Chief Economic Adviser Arvind Subramanian has referred to it to show that inflation currently is at very low levels. Annual inflation based on the GDP deflator was 1.66 per cent during April-June and 0.21 per cent in the preceding quarter. It was even lower based on the GVA deflator: 0.07 per cent in April-June, and minus 0.13 per cent in January-March. (GVA is essentially GDP net of all product taxes and subsidies; the GVA deflator, hence, yields a truer picture of the underlying inflation in the economy.) According to Subramanian, the near-flat GDP/GVA deflators indicate that “we are closer to deflation territory and far, far away from inflation territory”.
How does this tally with the inflation rates based on the more commonly-known wholesale price index (WPI) and consumer price index (CPI)?
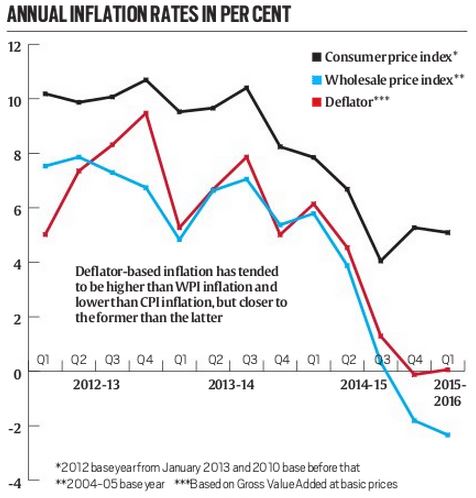
WPI inflation is already in negative territory for the last nine consecutive months since November. It averaged 0.33 per cent in October-December, minus 1.82 per cent in January-March and minus 2.35 per cent in the April-June quarter. On the other hand, CPI inflation — which the Reserve Bank of India (RBI) employs as the “nominal anchor” for its monetary policy operations — has been much higher, averaging 5.27 per cent in January-March and 5.09 per cent in April-June. The accompanying chart shows that the deflator-based inflation has tended to be higher than WPI inflation and lower than CPI inflation, but closer to the former than the latter.
Of the three, which is the most reliable measure?
As already mentioned, the deflator is the most accurate indicator of the underlying inflationary tendency, as it covers all goods and services produced in the economy. The other two indices derive from price quotations for select commodity baskets. The WPI basket includes 676 commodities; all of these are only goods and whose prices are captured at the wholesale/producer level. The CPI considers inflation at the retail end, while also including services.
But since only goods and services directly consumed by households — from foodstuffs, clothing and petrol to health, education and recreation services — are taken, the CPI does not tell us what is happening to prices of cement, steel, polyester yarn or compressors. While retail inflation is, no doubt, important, policymakers cannot ignore the prices that producers — both of consumer as well as various intermediate and capital goods — are receiving. Prolonged negative WPI inflation could, indeed, be indicative of deflationary pressures not being adequately reflected in the CPI. Given all these, the deflator is a better gauge of inflation (or even deflation, as Subramanian is suggesting) in the economy.
So, why is the deflator not much in use?
The main reason is that it is available only on a quarterly basis along with GDP estimates, whereas CPI and WPI data are released every month.
Why is the RBI stuck on CPI inflation when both the deflator and WPI inflation rates point to the possibility of the Indian economy being in deflation mode?
The RBI’s basic logic for targeting CPI inflation is simple. The inflation thatconsumers experience or expect in future is what gets factored in wage bargains and also determines the allocation of household savings across different assets. The job of monetary policy is to see that the public’s inflation expectations are firmly anchored, so as to prevent any wage-price spirals. Interest rates will also have to be sufficiently above CPI inflation, so that households continue to park their savings in bank deposits as opposed to gold or real estate.
But the criticism of this approach is that it works in normal times, whereas today we have an abnormal situation of deflation — at least from the producers’ end. Given zero, if not negative, WPI or deflator inflation and 10 per cent-plus nominal borrowing rates, firms are effectively paying double-digit real interest rates. This is as unsustainable a situation as the negative real interest rates that savers were getting, not too long ago, on fixed deposits. That being the case, the benefits to producers from a sharp cut in interest rates may far out outweigh losses to savers. Also, savings ultimately come from incomes, which, in turn, are a function of growth and jobs in the economy. Monetary policy will probably have to reconcile itself to this reality. The RBI was behind the curve when inflation took off in 2011-12; it cannot afford to be behind the curve on deflation today.
Index of Industrial Production (IIP)
Index of Industrial Production (IIP)
September 25, 2011
The Index of
Industrial Production ( IIP) is an abstract number or
ratio which measures the growth of various sectors in the economy. In India,
IIP is a representative figure which measures the general level of
Industrial activity in the country. Being an abstract number, it does
not show volume of activity and only shows the
magnitude which represents the status of production in the
industrial sector for a given period of time as compared to a reference period
of time.
Contents
Key Historical Facts
An Interim
Index of Industrial Production was released from 1947, based upon
15 industries and with base year 1937. It was discontinued in 1949. The First
IIP was published in 1950 by Office of Economic Advisor, Ministry of
Commerce with base year 1937. The base year was later shifted from time
to time. Currently IIP data is released every month by CSO
(Central Statistical Office) which was set up in 1951. Current IIP Base year is
2004-05.
Composition of IIP
Currently, the Index
of Industrial Production comprises 682 individual items. These
items can be divided into two ways as follows:
Sector wise Composition
Sector wise , the
items included in IIP fall into three sectors viz. mining,
manufacturing and electricity sectors. The below tables shows
the items in base year 2004-05 and 1993-94 number and weightage of items sector
wise.
From the above table,
we note down that:
·
In the current IIP
index, there are 61 mining items and 620 manufacturing items. Only 1 item
(electricity) comes under electricity sector.
·
Maximum weightage is
of manufacturing items (755.27), followed by Mining (141.57) and Electricity
(103.16)
·
While updating the IIP
from 1993-94 to 2004-05, the weightage of manufacturing was brought down while
that of mining was increased. This is mainly because the contribution of the GrossDomestic Product of the Manufacturing
sector has decreased compared to other two sectors as per the National Accounts
Statistics.
Use wise Composition
Use wise, the 682
items are divided into basic goods, capital goods, intermediate goods and
consumer goods. Further, consumer goods is divided into consumer durables and
consumer non durables. The below table shows the items in IIPs with base year
1993-94 and 2004-05 with number of items therein.

From the above, table,
we note that:
·
In the IIP index, the
maximum weight is of basic goods, followed by Consumer Goods, followed by
Intermediate and Capital Goods. While updating IIP index from base year 1993-04
to 2004-05, the weightage of basic goods and consumer goods has gone up; while
that of capital goods and intermediate goods and come down.
·
The maximum weightage
is given to Basic goods, followed by Consumer Goods, followed by Intermediate
and Capital Goods. Among Consumer goods, the weightage of consumer non-durables
is much more than of durables.
Percentage Weightage of Core Industries
The eight Core
Industries viz. Fertilizers, Electricity, Refinery Products, Natural Gas,
Steel, Cement, Crude Oil and coal [remember this by
mnemonic FERNS-C3] is nearly 38% in the IIP. This is shown indecreasing
order as follows:
Industry
|
% Weightage in IIP
|
Electricity
|
10.32
|
Steel (Alloy + Non-alloy)
|
6.68
|
Refinery Products
|
5.94
|
Crude Oil
|
5.22
|
Coal
|
4.38
|
Cement
|
2.41
|
Natural Gas
|
1.71
|
Fertilizers
|
1.25
|
So, on the basis of
weightage the arrangement of six core industries in decreasing order is as
follows: Electricity> Steel >Refinery Products> Crude Oil
>Coal>Cement >Natural Gas> Fertilizers.
IN OTHER WORDS : The index of Industrial Production (IIP) conveys the status of production in the industrial sector of an economy in a given period of time, in comparison with a fixed reference point in the past. The IIP numbers, in India use 2004-05 as the base year for comparison.
The current Index of Industrial Production (IIP) with base 2004-05 has a broader coverage of 682 items comprising 61 from Mining & Quarrying, 620 from Manufacturing and 1 from Electricity Sector having the weightage of 14.16%, 75.53% and 10.32% respectively in the all-India IIP.
IIP is compiled using data received from 16 source agencies viz. Department of Industrial Policy & Promotion (DIPP); Indian Bureau of Mines; Central Electricity Authority; Joint Plant Committee; Ministry of Petroleum & Natural Gas; Office of Textile Commissioner; Department of Chemicals & Petrochemicals; Directorate of Sugar; Department of Fertilizers; Directorate of Vanaspati, Vegetable Oils & Fats; Tea Board; Office of Jute Commissioner; Office of Coal Controller; Railway Board; Office of Salt Commissioner and Coffee Board.
The Eight Core Industries comprise nearly 38 % of the weight of items included in the Index of Industrial Production (IIP). They are Coal, Crude Oil, Natural Gas, Petroleum Refinery Products,Fertilizers,Steel, Cement & Electricity.
The combined Index of Eight Core Industries stands at 172.7 in December,2014, which is 2.4 % higher compared to the index of December, 2013. Its cumulative growth during April to December, 2014-15 was 4.4 %.
No comments:
Post a Comment